
U.S. Black Friday & Cyber Week 2025 Ecommerce Sales Stats

U.S. Black Friday and Cyber Week 2025 are over, and the first wave of ecommerce sales statistics is finally in. Across Thanksgiving through Cyber Monday, U.S. shoppers spent about US$44.2B online, with clear shifts in how they shopped, what they bought and where they checked out.

In this article, we break the season down into six charts: overall Cyber Week sales, day-by-day performance, category mix, the rise of mobile and BNPL, platform-level shopper reach, and the impact of AI-driven traffic and revenue. If you care about U.S. Black Friday and Cyber Week 2025 ecommerce sales statistics, these are the numbers worth bookmarking.


U.S. Cyber Week 2025: US$44.2B Online(+7.7% YoY)

From Thanksgiving through Cyber Monday, U.S. shoppers spent US$44.2B online—about US$3B more than last year, according to Adobe Analytics.

U.S. Black Friday and Cyber Week 2025 ecommerce sales statistics: Total Cyber Week online spending comparison showing US$44.2B in 2025 (7.7% YoY growth) vs. US$41.1B in 2024.
Chart 1: U.S. Cyber Week 2025 total online sales hit US$44.2B, marking a 7.7% Year-over-Year increase from 2024.

Three Record Days in a Row

Thanksgiving reached US$6.4B online, Black Friday US$11.8B, and Cyber Monday US$14.25B—each setting a new U.S. record in 2025.

U.S. Black Friday and Cyber Week 2025 ecommerce sales statistics: Daily online spending peaks. Cyber Monday ($14.25B) is the highest, followed by Black Friday ($11.8B) and Thanksgiving ($6.4B).
Chart 2: Three Record Days in a Row. Online spending peaked on Cyber Monday with US$14.25B, demonstrating a strong sales progression from Thanksgiving.

What U.S. Shoppers Actually Bought

In Cyber Weekend 2025, 62% of shoppers bought apparel & shoes, 38% beauty, 34% groceries, 30% toys/games and 25% consumer electronics, according to Numerator.
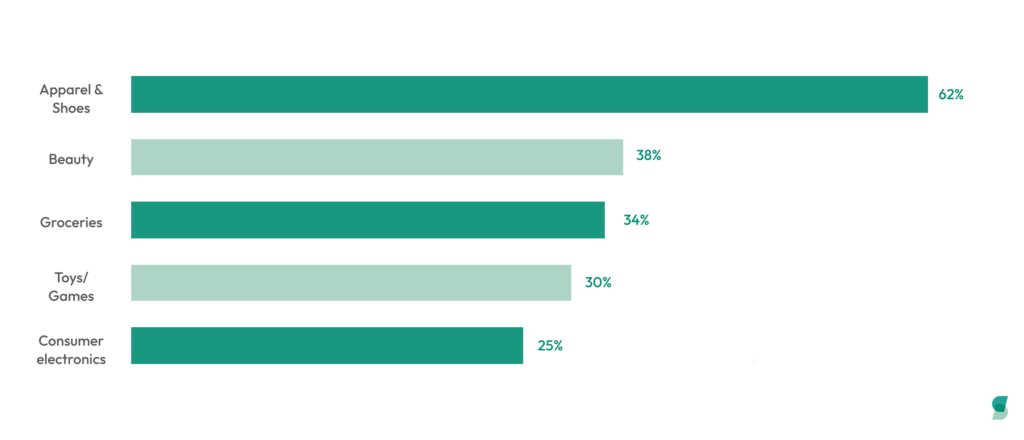
U.S. Black Friday and Cyber Week 2025 ecommerce sales statistics: Top product categories purchased during the shopping weekend, led by Apparel & Shoes (62%), Beauty (38%), and Groceries (34%).
Chart 3: What U.S. Shoppers Actually Bought. Apparel & Shoes was the most-purchased category at 62% of shoppers, followed by Beauty and Groceries.

Mobile & BNPL Are Reshaping Black Friday

On Black Friday 2025, 58.6% of U.S. online spend—about US$5.1B—came from mobile, while“buy now, pay later” handled roughly US$0.75B in purchases, up about 31% year over year.

U.S. Black Friday and Cyber Week 2025 ecommerce sales statistics: Mobile and BNPL growth. Mobile accounts for 58.6% of sales, while Buy Now, Pay Later (BNPL) spending increased by 30.85% YoY.
Chart 4: Mobile & BNPL Are Reshaping Black Friday. 58.6% of sales came from mobile, while BNPL spending soared by +30.85% year over year.

Where Cyber Weekend Shoppers Actually Shopped

Numerator finds 87% of U.S. Cyber Weekend buyers shopped or planned to shop on Amazon, 65% on Walmart and 42% on Target—while fewer than 1 in 10 visited Temu(10%), TikTok Shop(8%) or Shein(8%).
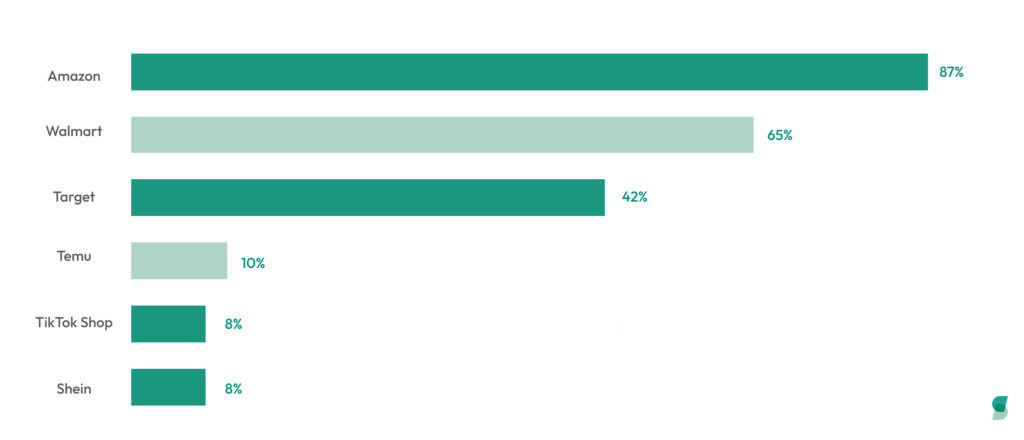
U.S. Black Friday and Cyber Week 2025 ecommerce sales statistics: Platform penetration rate comparison. Amazon (87%) dominates shopper reach, followed by Walmart (65%), Target (42%), and emerging platforms like Temu (10%) and TikTok Shop (8%).
Chart 5: Where Cyber Weekend Shoppers Actually Shopped. Amazon leads with 87% of shoppers, demonstrating the platform’s overwhelming market dominance.

AI Shopping Explodes: +805% Traffic

According to Statistics.BlackFriday, AI-driven clicks to U.S. retail sites jumped 805% year over year, with AI tools and agents helping generate nearly US$3B in online sales in 2025.

U.S. Black Friday and Cyber Week 2025 ecommerce sales statistics: AI-driven traffic and revenue. AI traffic exploded by +805%, driving US$3B in online sales.
Chart 6: AI Shopping Explodes. AI-driven traffic surged by +805% year-over-year, helping generate nearly US$3B in online sales.

👉 Want to learn more about us ? Book a demo with Synctify today.

Privacy Overview

This website uses cookies so that we can provide you with the best user experience possible. Cookie information is stored in your browser and performs functions such as recognising you when you return to our website and helping our team to understand which sections of the website you find most interesting and useful.

Strictly Necessary Cookies

Strictly Necessary Cookie should be enabled at all times so that we can save your preferences for cookie settings.

3rd Party Cookies

This website uses Google Analytics to collect anonymous information such as the number of visitors to the site, and the most popular pages.

Keeping this cookie enabled helps us to improve our website.